Thursday 25 January 2018

Buckeye and Westpark Rent Prices 2013-2017

Real Property Management West Valley Phoenix studied Buckeye, AZ and the Westpark subdivision rental prices and other rental property market data from 2013-2017.

Westpark, Buckeye is a subdivision that is roughly located south of the 10 and north of Warner Street. Westpark, Buckeye is east of Rooks Rd. and west of Miller Rd. 

All of Real Property Management West Valley Phoenix rental market figures for Buckeye are taken from closed rental data from the Arizona MLS from 2013-2015.

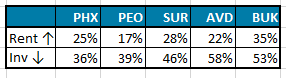
The rental market numbers in Buckeye and Westpark are very similar. Attached is our summary chart.


The average rental home price gain from 2013 to 2017 in Buckeye, AZ is a solid 20%. 

For the rental houses in Westpark, Buckeye the five year rental price gain of 24.0% is better than Buckeye. 

However, houses in the Westpark subdivision rent for about $150 less per month than the  Buckeye collectively.


For all of your Phoenix Real Estate & Phoenix Property Management Needs Contact:
Real Property Management West Valley Phoenix
www.rpmwvphx.com
info@rpmwvphx.com
623-748-7800

Tuesday 23 January 2018

Real Property Management West Valley Phoenix Latest Podcast


Join Lisa with Real Property Management West Valley Phoenix to hear about average days to rent broken down by city on the Real Property Management West Valley Phoenix Manage My Home podcast.


For all of your Phoenix Real Estate & Phoenix Property Management Needs Contact:
Real Property Management West Valley Phoenix
www.rpmwvphx.com
info@rpmwvphx.com
623-748-7800

Thursday 18 January 2018

Phoenix and Dynamite Mountain Ranch rent prices 2013-2017

The following numbers will highlight the Real Property Management West Valley Phoenix study of the Phoenix and Dynamite Mountain Ranch rental market from 2013-2017.

Real Property Management West Valley Phoenix looked at key rental market statistics in the City of Phoenix, AZ and in the Dynamite Mountain ranch subdivision.

All figures that Real Property Management West Valley Phoenix used in this study are taken from closed rental data from the MLS.

Dynamite Mountain Ranch is a subdivision that is east of I-17 and north of Happy Valley Road. It has 1,045 homes within the subdivision.

From 2013-2017 there have been 383 homes listed for rent on the Arizona MLS in the Dynamite Mountain Ranch subdivision.

Real Property Management West Valley Phoenix manages several homes in this subdivision.

The rental property data we look at from Phoenix and Dynamite Mountain Ranch focuses on unfurnished rental properties.


The rental price numbers for the city of Phoenix in this study are consistent with what Real Property Management West Valley Phoenix has studied in other cities around Phoenix.

The Dynamite Mountain ranch rental property data showed nice gains and rental prices are trending upward. Median days on market regarding these rental properties are showing some steady declines which is good for landlords.

Overall, average rental prices in Phoenix has increased during this 2013-2017 time period. The average rental price has increased from 2013 to 2017 in Phoenix by $242. The average rental price in Dynamite Mountain Ranch went up $221 in this same time period.

Thursday 11 January 2018

Real Property Management West Valley Phoenix rent price comparison 2013-2017

On the last post, Real Property Management West Valley Phoenix, looked at rent prices in the Phoenix area and selected West Valley cities.

This week Real Property Management West Valley Phoenix will look at the same data but show it a bit differently with line charts that re-emphasize the increase in rental price. These charts will show a graphical picture of the data and rent price increase from 2013-2017 for the following cities.

Surprise (SUR) – rent price increase of 28%  
Phoenix (PHX) – rent price increase of 25%
Peoria (PEO) - rent price increase of 19%
Avondale (AVD)- rent price increase of 22%
Buckeye (BUK)- rent price increase of 35%

These are large increases when compared with the Consumer Price Index which rose 7% from 2013-2107.


Keep in mind, the rental property data that Real Property Management West Valley Phoenix uses this comparison is at for closed, unfurnished rental properties and is taken from the Arizona MLS.


Wednesday 3 January 2018

Greater Phoenix Rental Market Data by City 2013-2107

Let’s look the Greater Phoenix Rental market data and three charts that break down by city in a few categories. The cities are as follows:

Surprise (SUR)
Phoenix (PHX)
Peoria (PEO)
Avondale (AVD)
Buckeye (BUK)

We have compiled data for these five Valley markets. The data represents each year's closed, unfurnished rental properties and is taken from the Arizona MLS.

We will present three charts. The first chart shows raw rental price per square foot in each city. 


In each city, the rental price per square has gone up consistently in each year and rental price per square foot increase ranges from 14% to 26%. The largest increase in rent per sq. foot by percentage from 2013-2017 occurred in Buckeye.

The next chart shows rental property inventory.


This chart details the significant reduction in rental properties available and shows that the Phoenix rental property inventory is greater than the rest of the cities inventory combined.

The final Chart shows the increase in rent price/decrease inventory as a percentage.


This chart shows good rental market price gains. It is interesting to note the drastic reduction in rental inventory on the Arizona MLS from 2013 to 2015.