Monday, 24 August 2015

Tolleson, AZ and Farmington Glen Subdivision Rental Property Market Comparison 1st and 2nd Quarter 2013 to 2015

On the last post, we took a look at the city of Buckeye, AZ and the Sundance subdivision's 2013 to 2015 pertinent rental market figures.


This week we will take a look at the Tolleson market and a subdivision in Tolleson. 

Tolleson city limits are roughly between McDowell Road and Buckeye Road north/south between 83rd and 99th Avenues east/west.  They extend from Van Buren St. to Buckeye road from 99th Ave/107th Ave east/west  and 83rd ave/75 Ave east/west.


All figures are taken from closed rental data from the MLS. The break down will focus on the subdivision of Farmington Glen.

We will focus on the rental homes listed in quarters 1 and 2 and break down the resulting rental data by year.The rental property data we look at from Tolleson and Farmington Glen focuses on closed, unfurnished rental properties.

Let's take a look at the Tolleson and Farmington Glen rental market data.

The rental market numbers for Tolleson in this study show nice gains as detailed below.


Overall, average rental prices in both Tolleson and Farmington Glen have increased during this 2013-2015 time period. The average rental price in Tolleson has gone up 10% in three years. In Farmington Glen, the increase in rent in this time frame has been 16%. 

Rental property inventory decrease in these areas has been pretty drastic with a 55% decrease in Tolleson rental property inventory from 2013-2015. In this same time frame, Farmington Glen rental property has remained stable but this could be due to the small sample size.

Both the Farmington Glen subdivision and the Tolleson,AZ rental properties show a very sharp drop in the Average Days on Market from 2013 to 2015. 

The Tolleson rental market  is tight for renters but a great option for property investors.

Monday, 17 August 2015

Buckeye, AZ and Sundance Subdivision Rental Property Market Comparison 1st and 2nd Quarter 2013 to 2015

On the last post, we took a look at the city of Peoria, AZ and the Arrowhead Ranch subdivision's 2013 to 2015 pertinent rental market figures.


This week, we will move the rental market comparison to Buckeye and look at how rental market statistics from 1st and 2nd Quarters 2013-2015 in Buckeye, AZ compare with a different subdivision within Buckeye.
All figures are taken from closed rental data from the MLS. The break down will focus on the subdivision of Sundance.

Sundance  is a subdivision that is roughly between McDowell road and Yuma north/south and Watson road and 223rd east/west. 

We will focus on the rental homes listed in quarters 1 and 2 and break down the resulting rental data by year.The rental property data we look at from Buckeye and Sundance focuses on closed, unfurnished rental properties.

Let's take a look at the Buckeye and Sundance rental market data.

The rental market numbers for Buckeye in this study show some pretty good gains as detailed below.


Overall, average rental prices in both Buckeye and Sundance have increased during this 2013-2015 time period. The average rental price in Buckeye has gone up 16% in three years. In Sundance, the increase in rent in this time frame has been 7%. 

Rental property inventory decrease in these areas has been pretty drastic with a 41% decrease in Buckeye rental property inventory from 2013-2015. In this same time frame, Sundance rental property inventory has declined by a whopping 55%.

Both the Sundance subdivision and the Buckeye,AZ rental properties show a very sharp drop in the Average Days on Market from 2013 to 2015. 

The Buckeye rental market is very under rated and all of the rental market data indicate that times have been golden for rental property investors here over the last three years.

Thursday, 13 August 2015

Peoria, AZ and Arrowhead Ranch Subdivision Rental Property Market Comparison 1st and 2nd Quarter 2013 to 2015

On the last post, we took a look at the city of Scottsdale, AZ and the Grayhawk subdivision's 2013 to 2015 pertinent rental market figures.


This week, we will move the rental market comparison to Peoria and look at how rental market statistics from 1st and 2nd Quarters 2013-2015 in Peoria, AZ compare with a different subdivision within Peoria.
All figures are taken from closed rental data from the MLS. The break down will focus on the subdivision of Arrowhead Ranch.

Arrowhead Ranch is a subdivision that roughly extends from 51st Ave to the 101 on on East/West basis and Deer Valley Road to Union Hills on a North/South basis. 

We will focus on the rental homes listed in quarters 1 and 2 and break down the resulting rental data by year.The rental property data we look at from Peoria and Arrowhead Ranch focuses on closed, unfurnished rental properties.

Let's take a look at the Peoria and Arrowhead Ranch rental market data.

The rental market numbers for Peoria in this study are interesting because they are not consistent with what we have experienced with the overall 2015 Phoenix Area Rental Market. 


Overall, average rental prices in both Peoria and Arrowhead Ranch have remained relatively flat during this 2013-2015 time period. The median rental price has increase from 2013 to 2015 in Peoria by $100, but only increased by $13 in Arrowhead Ranch. 

Rental property inventory decrease in these areas has not been as significant as the Phoenix rental market in general inventory decrease within the same time frame. Arrowhead Ranch rental property inventory has remained even over the last three years.

In Peoria average rental property rent rates in the time frames analyzed have increased only about 1% (from $1283 to $1298). The median rental price has shown an 8% increase. 

Arrowhead Ranch rental properties show a very sharp drop in the Average Days on Market from 2013 to 2015. This is interesting because the prices haven't changed much nor has the inventory.

Monday, 3 August 2015

Scottsdale, AZ and Grayhawk Subdivision Rental Property Market Comparison 1st and 2nd Quarter 2013 to 2015

On the last post, we took a look at the city of Laveen, AZ and the Country Glen subdivision's 2013 to 2015 pertinent rental market figures.


This week, we will move the rental market comparison to Scottsdale and look at how rental market statistics from 1st and 2nd Quarters 2013-2015 in Scottsdale, AZ compare with a different subdivision within Scottsdale.
All figures are taken from closed rental data from the MLS. The break down will focus on the subdivision of Grayhawk.

Grayhawk is a large subdivision that is east of Scottsdale Road, West Of Pima Rd and north of Thompson Peak Parkway. 

We will focus on the rental homes listed in quarters 1 and 2 and break down the resulting rental data by year.The rental property data we look at from Scottsdale and Grayhawk focuses on closed, unfurnished rental properties.

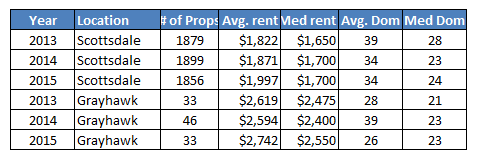
Let's take a look at the Scottsdale and Grayhawk rental market data.


The rental market numbers for the city of Scottsdale in this study are consistent with what we have experienced with the overall 2015 Phoenix Area Rental Market. 

The Grayhawk market is very interesting and it shows good overall gains. However, the Grayhawk market took a turn for the worse in 2014 in all areas. It rebounded nicely in 2015. 

Overall, average rental prices in Scottsdale have increased during this 2013-2015 time period.  by $175. The average rental price in Grayhawk went up $133.

Monday, 27 July 2015

Laveen, AZ and Country Glen Subdivision Rental Property Market Comparison 1st and 2nd Quarter 2013 to 2015

On the last post, we took a look at the city of Phoenix, AZ and the Dynamite Mountain Ranch subdivision's 2013 to 2015 pertinent rental market figures.


This week, we will move the rental market comparison a bit south of Phoenix proper and look at how rental market statistics from 1st and 2nd Quarters 2013-2015 in Laveen, AZ compare with a different subdivision. 

All figures are taken from closed rental data from the MLS. The break down will focus on the subdivision of Country Glen.

Country Glen is a small subdivision that is east of 47th Ave and north of Baseline Road. 

We will focus on the rental homes listed in quarters 1 and 2 and break down the resulting rental data by year.The rental property data we look at from Laveen and Country Glen focuses on closed rental properties.

Let's take a look at the Laveen and Country Glen rental market data.


The rental market numbers for the city of Laveen in this study are consistent with what we have experienced with the overall 2015 Phoenix Area Rental Market. 

The Country Glen market is hard to gauge due to sample size but it shows some decent gains with the limited data and rental prices are trending upward. Median days on market regarding these rental properties are showing some sharp declines which is good for landlords.

Overall, average rental prices in Laveen has increased during this 2013-2015 time period.  by $100. The average rental price in Country Glen went up $79.

Monday, 20 July 2015

Phoenix, AZ and Dynamite Mountain Ranch Rental Property Market Comparison 1st and 2nd Quarter 2013 to 2015

On the last post, we took a look at the city of Phoenix, AZ and the Desert Ridge subdivision's 2013 to 2015 pertinent rental market figures.


This week, we will keep the rental market comparison in Phoenix and look at how rental market statistics from 1st and 2nd Quarters 2013-2015 in the City of Phoenix, AZ compare with a different subdivision. 

All figures are taken from closed rental data from the MLS. The break down will focus on the subdivision of Dynamite Mountain Ranch.

Dynamite Mountain Ranch is a subdivision that is east of I-17 and north of Happy Valley Road. It has 1,045 homes within the subdivision. From 1/1//2013 to 7/19/2015, there have been 216 homes listed for rent on the Arizona MLS . 

We will focus on the rental homes listed in quarters 1 and 2 and break down the resulting rental data by year.The rental property data we look at from Phoenix and Dynamite Mountain Ranch focuses on closed rental properties.

Let's take a look at the Phoenix and Dynamite Mountain Ranch rental market data.


The rental market numbers for the city of Phoenix in this study are consistent with what we have experienced with the overall 2015 Phoenix Area Rental Market. 

The Dynamite Mountain ranch rental property data shows some decent gains and rental prices are trending upward. Median days on market regarding these rental properties are showing some sharp declines which is good for landlords.

Overall, average rental prices in Phoenix has increased during this 2013-2015 time period. The average rental price has increase from 2013 to 2015 in Phoenix by $167. The average rental price in Dynamite Mountain Ranch went up $94.

Monday, 13 July 2015

Phoenix, AZ and Desert Ridge Rental Property Market Comparison 1st and 2nd Quarter 2013 to 2015

On the last post, we took a look at the city of Buckeye, AZ and the Festival Foothills subdivision's 2013 to 2015 pertinent rental market figures.


This week, we will look at rental market statistics from 1st and 2nd Quarters 2013-2015 in the City of Phoenix, AZ. All figures are taken from closed rental data from the MLS.

The break down will focus on the subdivision of Desert Ridge.

We analyzed the Phoenix and Desert Ridge rental market data from 1st quarter and 2nd Quarter of 2013 and 2014 and compared it with data from 1st Quarter and 2nd Quarter to date in 2015. The rental property data is from the Arizona MLS and focuses on closed rental properties.

Let's take a look at the Phoenix and Desert Ridge rental market data.


The rental market numbers for the city of Phoenix in this study are consistent with what we have experienced with the overall 2015 Phoenix Area Rental Market. The Desert Ridge rental property data has some interesting quirks but prices still trending upward like the rest of the market although not at the same rate of acceleration.

Overall, average rental prices in Phoenix has increased during this 2013-2015 time period. The average rental price has increase from 2013 to 2015 in Phoenix by $167. the average rental price in Desert Ridge but has only increased by $125. Percentage increase in average rental price from 2013 to 2015 in Phoenix and Desert Ridge was 14% and 6% respectively. Rental property inventory has decreased significantly in Phoenix.

What is interesting about Desert Ridge and Phoenix is that the average days on market has gone up a bit from 2013 to 2015. This differs with many of the markets that we have studied so far.